
Introduction to Japanese Candlesticks
Japanese candlesticks are a popular charting technique used in the forex trading market to visually represent price movements over a specific period. Originating from Japan in the 18th century, this method was developed by rice traders, primarily to track prices and improve trading strategies. The candlesticks’ design provides a clear, comprehensive view of market trends, making them a valuable tool for traders aiming for informed decision-making.
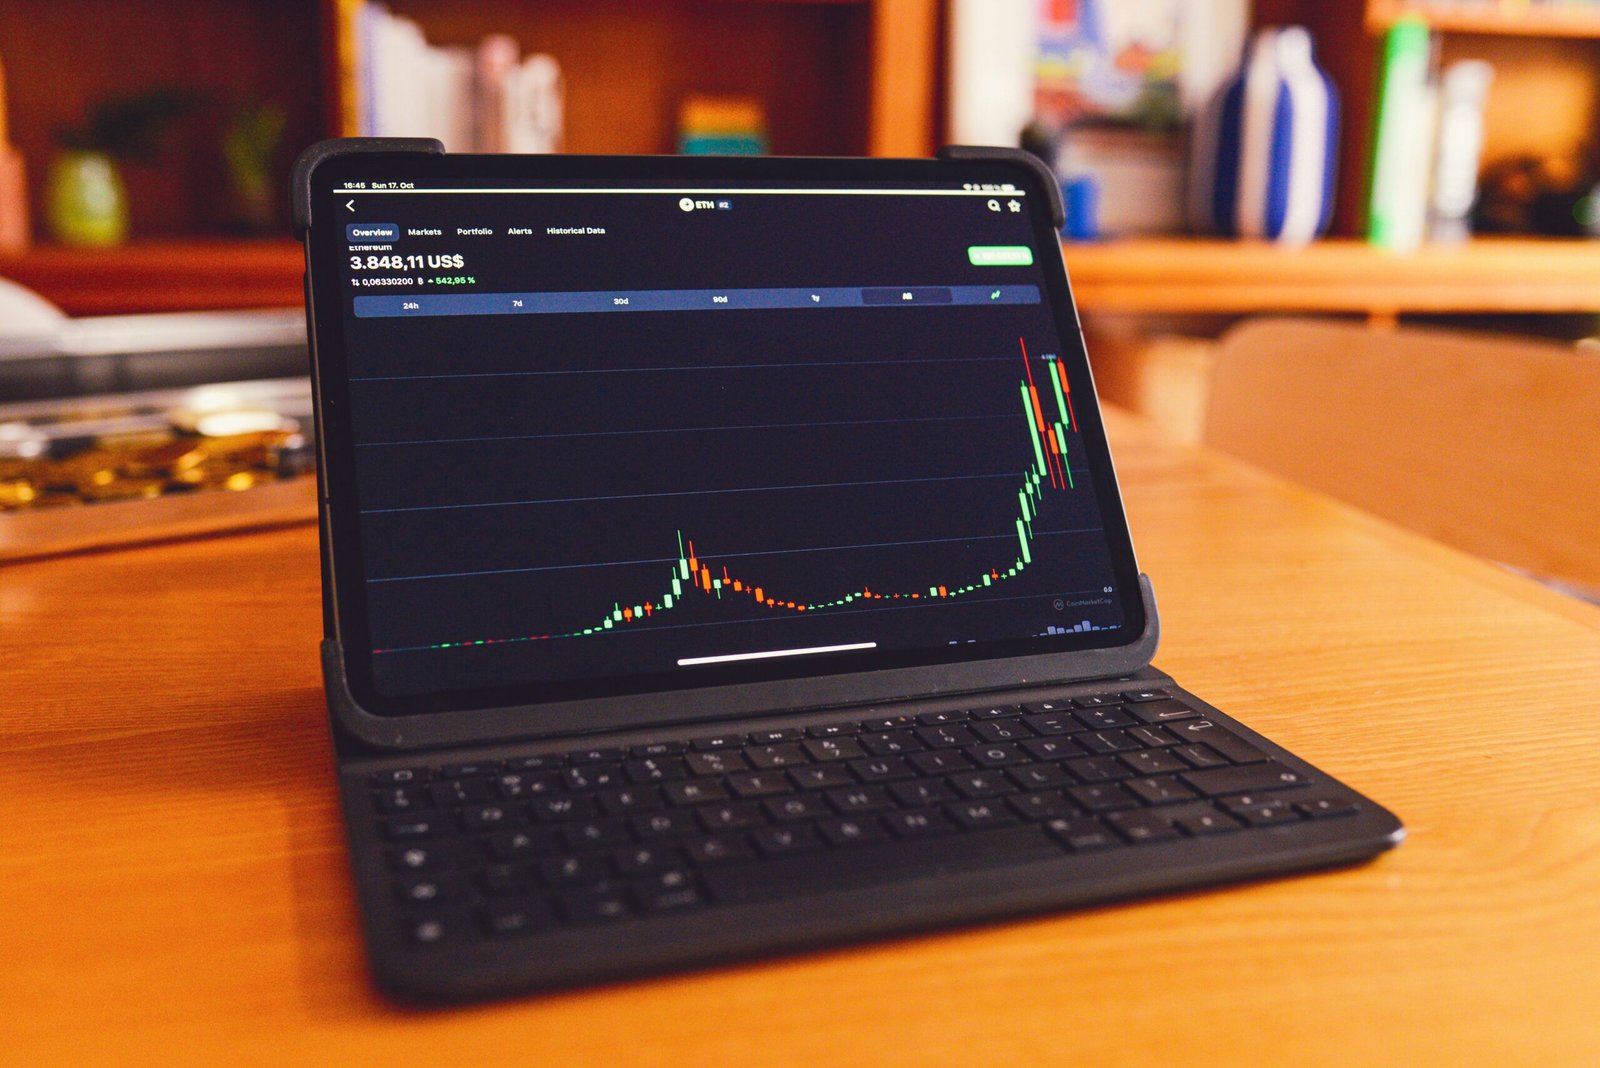
A candlestick is composed of several key components: the body, the upper wick, and the lower wick. The body represents the difference between the opening and closing prices within the chosen timeframe, indicating whether the market has moved up or down. In contrast, the wicks, also known as shadows, extend from the body to indicate the highest and lowest prices reached during that period. The colors of the candlestick—typically green for a closing price higher than the opening, and red for a closing price lower than the opening—further illustrate market sentiment and can hint at future price movements.
Understanding the elements of Japanese candlesticks is crucial for forex traders, as these candlesticks provide insights into market behavior. They reflect buying and selling pressures, creating a visual representation that can help traders identify trends and potential reversal points. Moreover, traders often look for specific patterns formed by combinations of candlesticks, known as candlestick patterns. These patterns, which can signal continuation or reversal of trends, are foundational in technical analysis, allowing traders to make strategic decisions based on historical price action.
Overall, Japanese candlesticks serve as an essential tool in the forex market, fostering a deeper comprehension of price fluctuations and aiding traders in navigating complex market environments.
Interpreting Candlestick Patterns
In the realm of forex trading, Japanese candlestick patterns serve as crucial indicators of market sentiment and potential price movements. Understanding how to read these patterns can significantly enhance a trader’s ability to make informed decisions. There are two primary categories of candlestick patterns: single candlestick patterns and multiple candlestick patterns.
Single candlestick patterns include formations such as the Doji, Hammer, and Engulfing patterns. The Doji represents a period of indecision in the market, where the opening and closing prices are virtually equal. This often indicates a potential reversal in trend, especially when combined with preceding price action. The Hammer candlestick, characterized by a small body and a long lower shadow, typically appears at the bottom of a downtrend, signaling a potential bullish reversal. Conversely, the Engulfing pattern, which consists of two candles where the second candle completely engulfs the first, can suggest a shift in momentum. A bullish engulfing pattern occurs at the end of a downtrend, while a bearish engulfing pattern signals a possible downturn following an uptrend.
Moving on to multiple candlestick patterns, the Morning Star and Evening Star are noteworthy formations. The Morning Star is a three-candle pattern that appears at the bottom of a downtrend, representing a potential reversal. It typically includes a long bearish candle, followed by a short-bodied candle, and concludes with a long bullish candle. In contrast, the Evening Star serves as a bearish reversal signal occurring at the top of an uptrend, similarly characterized by three candles. Both patterns are essential for identifying significant shifts in market direction.
Understanding these candlestick patterns equips traders with the tools to analyze market conditions effectively. By being able to read and interpret these formations, traders can make better trading decisions and manage risk more efficiently.
Using Japanese Candlesticks for Trading Strategies
Japanese candlesticks serve as a crucial tool in forex trading, offering traders a visually intuitive method to analyze price movements. The rich information encapsulated within each candlestick, including open, close, high, and low prices, enables traders to make informed decisions. When incorporated into trading strategies, candlestick patterns enhance the trader’s ability to identify market trends and potential reversal points.
To effectively utilize candlestick analysis, traders often combine these patterns with other technical indicators such as moving averages or Relative Strength Index (RSI). For instance, a bullish engulfing candlestick pattern appearing above a 50-period moving average may signify a strong upward trend and serve as a potential entry point. Conversely, a bearish pattern near a resistance level can act as a signal to consider short positions. This confluence of signals helps traders refine their setups and improve the overall accuracy of their trades.
Risk management is another area where candlestick patterns shine. By establishing stop-loss orders based on recent candlestick formations, traders can protect their capital from adverse market movements. For instance, placing a stop-loss just below the low of a bullish candlestick pattern can provide a safety net in case the market reverses unexpectedly.
Furthermore, back-testing trading strategies that incorporate candlestick patterns is vital for developing a personalized approach to forex trading. Traders can analyze historical data to assess the effectiveness of specific patterns in conjunction with other indicators. This practice not only bolsters confidence in their strategy but also aids in identifying potential weaknesses that can be addressed through adjustments.
Incorporating Japanese candlestick analysis into trading strategies allows for a comprehensive approach to forex trading. By effectively combining candle patterns with additional indicators, managing risks, and back-testing strategies, traders can significantly improve their decision-making process and overall trading performance.
Common Mistakes and Best Practices
Japanese candlesticks offer valuable insights into market trends and price action, but traders often make critical mistakes that can lead to unfavorable outcomes. One of the most prevalent errors is over-reliance on candlestick patterns without sufficient consideration of the broader market context. While these patterns can indicate potential price movements, they are not foolproof and may produce false signals if traders ignore underlying market conditions, such as economic news or geopolitical events. It is essential to analyze candlestick formations within the broader framework of fundamental and technical analysis to enhance trading decisions.
Another common pitfall involves neglecting risk management principles, which can severely impact a trader’s success. Many new traders fail to set appropriate stop-loss orders or overly widen their profit targets based solely on candlestick patterns. Adopting a disciplined approach to risk management is crucial; this means determining position sizes and risk-to-reward ratios before entering any trade. Such practices ensure that potential losses are minimized and that gains are maximized over time.
The importance of continuous education in candlestick charting cannot be overstated. Traders should strive to deepen their understanding through courses, forums, or books focused on technical analysis and candlestick strategies. Engaging with the trading community and sharing insights can enhance knowledge and foster successful habits. Additionally, back-testing different candlestick strategies against historical data enables traders to learn what works best in various market scenarios.
Ultimately, traders can increase their success rates by avoiding common mistakes, such as relying solely on candlestick patterns and neglecting comprehensive analysis. By implementing best practices like disciplined risk management and ongoing educational pursuits, traders can navigate the complexities of Forex trading more effectively.